tom7
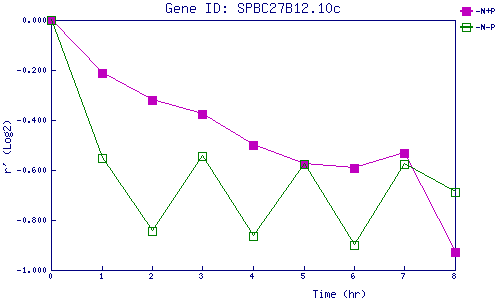
| 0 | 1 | 2 | 3 | 4 | 5 | 6 | 7 | 8 | |
| -N+P | 0.000 | -0.213 | -0.321 | -0.377 | -0.500 | -0.576 | -0.590 | -0.531 | -0.927 |
| -N-P | 0.000 | -0.553 | -0.843 | -0.544 | -0.864 | -0.576 | -0.901 | -0.578 | -0.688 |
|
-N+P: Nitrogen starved in the presence of P-factor -N-P: Nitrogen starved in the absence of P-factor |