rga4
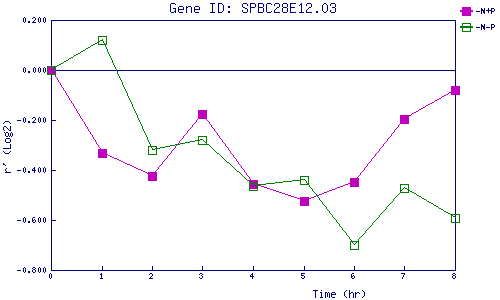
| 0 | 1 | 2 | 3 | 4 | 5 | 6 | 7 | 8 | |
| -N+P | 0.000 | -0.332 | -0.426 | -0.174 | -0.455 | -0.524 | -0.449 | -0.196 | -0.079 |
| -N-P | 0.000 | 0.120 | -0.319 | -0.279 | -0.465 | -0.439 | -0.701 | -0.470 | -0.593 |
|
-N+P: Nitrogen starved in the presence of P-factor -N-P: Nitrogen starved in the absence of P-factor |
