| 0 | 1 | 2 | 3 | 4 | 5 | 6 | 7 | 8 | |
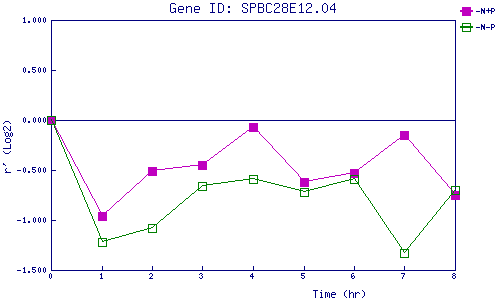
| -N+P | 0.000 | -0.964 | -0.512 | -0.450 | -0.071 | -0.618 | -0.532 | -0.152 | -0.750 |
| -N-P | 0.000 | -1.220 | -1.079 | -0.661 | -0.592 | -0.723 | -0.593 | -1.332 | -0.703 |
|
-N+P: Nitrogen starved in the presence of P-factor -N-P: Nitrogen starved in the absence of P-factor |