| 0 | 1 | 2 | 3 | 4 | 5 | 6 | 7 | 8 | |
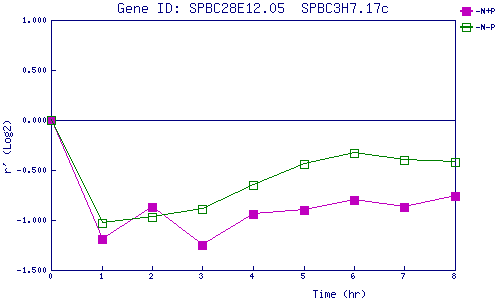
| -N+P | 0.000 | -1.186 | -0.874 | -1.250 | -0.944 | -0.898 | -0.802 | -0.873 | -0.759 |
| -N-P | 0.000 | -1.030 | -0.971 | -0.887 | -0.651 | -0.440 | -0.330 | -0.400 | -0.420 |
|
-N+P: Nitrogen starved in the presence of P-factor -N-P: Nitrogen starved in the absence of P-factor |