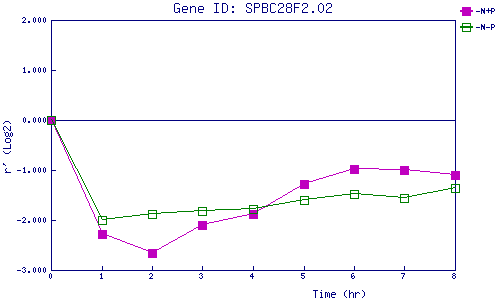
| 0 | 1 | 2 | 3 | 4 | 5 | 6 | 7 | 8 | |
| -N+P | 0.000 | -2.281 | -2.662 | -2.104 | -1.882 | -1.273 | -0.975 | -0.993 | -1.100 |
| -N-P | 0.000 | -1.999 | -1.878 | -1.820 | -1.778 | -1.594 | -1.480 | -1.564 | -1.355 |
|
-N+P: Nitrogen starved in the presence of P-factor -N-P: Nitrogen starved in the absence of P-factor |