ppi1 cyp2
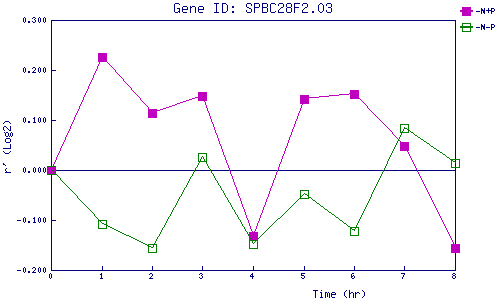
| 0 | 1 | 2 | 3 | 4 | 5 | 6 | 7 | 8 | |
| -N+P | 0.000 | 0.226 | 0.114 | 0.148 | -0.131 | 0.142 | 0.151 | 0.047 | -0.155 |
| -N-P | 0.000 | -0.108 | -0.155 | 0.026 | -0.149 | -0.048 | -0.122 | 0.085 | 0.014 |
|
-N+P: Nitrogen starved in the presence of P-factor -N-P: Nitrogen starved in the absence of P-factor |