cwf7 spf27
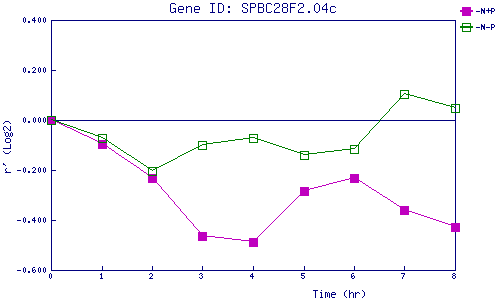
| 0 | 1 | 2 | 3 | 4 | 5 | 6 | 7 | 8 | |
| -N+P | 0.000 | -0.095 | -0.232 | -0.466 | -0.490 | -0.284 | -0.232 | -0.361 | -0.427 |
| -N-P | 0.000 | -0.074 | -0.204 | -0.101 | -0.073 | -0.139 | -0.117 | 0.102 | 0.049 |
|
-N+P: Nitrogen starved in the presence of P-factor -N-P: Nitrogen starved in the absence of P-factor |