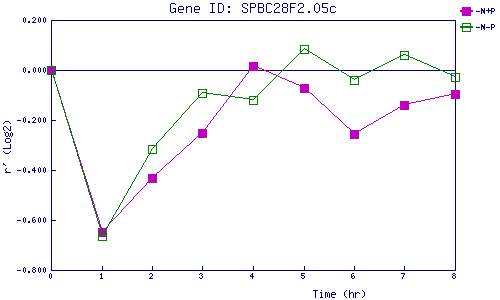
| 0 | 1 | 2 | 3 | 4 | 5 | 6 | 7 | 8 | |
| -N+P | 0.000 | -0.648 | -0.433 | -0.252 | 0.017 | -0.074 | -0.257 | -0.140 | -0.094 |
| -N-P | 0.000 | -0.663 | -0.315 | -0.093 | -0.121 | 0.085 | -0.041 | 0.059 | -0.027 |
|
-N+P: Nitrogen starved in the presence of P-factor -N-P: Nitrogen starved in the absence of P-factor |