mdm12
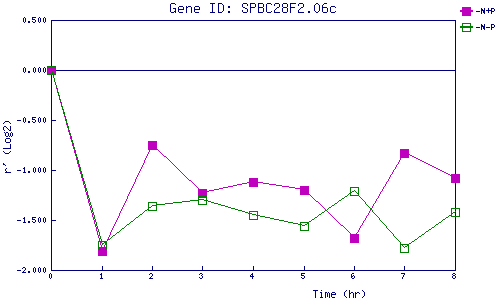
| 0 | 1 | 2 | 3 | 4 | 5 | 6 | 7 | 8 | |
| -N+P | 0.000 | -1.806 | -0.749 | -1.228 | -1.124 | -1.204 | -1.677 | -0.827 | -1.075 |
| -N-P | 0.000 | -1.748 | -1.358 | -1.303 | -1.449 | -1.565 | -1.208 | -1.780 | -1.423 |
|
-N+P: Nitrogen starved in the presence of P-factor -N-P: Nitrogen starved in the absence of P-factor |