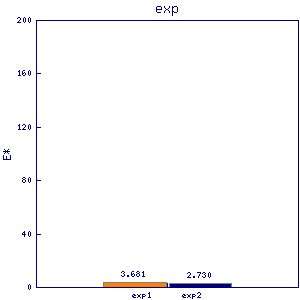
sfr1
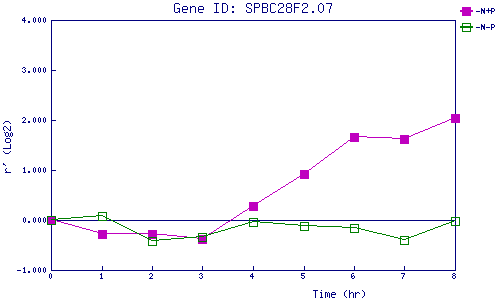
| 0 | 1 | 2 | 3 | 4 | 5 | 6 | 7 | 8 | |
| -N+P | 0.000 | -0.287 | -0.271 | -0.378 | 0.270 | 0.927 | 1.659 | 1.623 | 2.034 |
| -N-P | 0.000 | 0.090 | -0.423 | -0.332 | -0.044 | -0.112 | -0.155 | -0.400 | -0.015 |
|
-N+P: Nitrogen starved in the presence of P-factor -N-P: Nitrogen starved in the absence of P-factor |