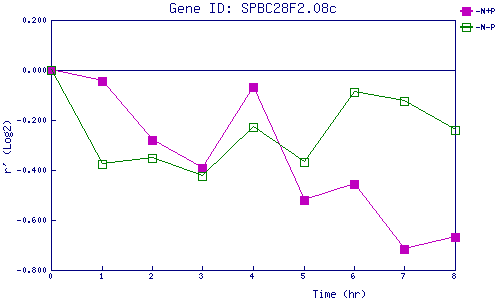
| 0 | 1 | 2 | 3 | 4 | 5 | 6 | 7 | 8 | |
| -N+P | 0.000 | -0.044 | -0.282 | -0.391 | -0.068 | -0.522 | -0.458 | -0.715 | -0.669 |
| -N-P | 0.000 | -0.375 | -0.354 | -0.423 | -0.229 | -0.367 | -0.090 | -0.124 | -0.239 |
|
-N+P: Nitrogen starved in the presence of P-factor -N-P: Nitrogen starved in the absence of P-factor |