kap1
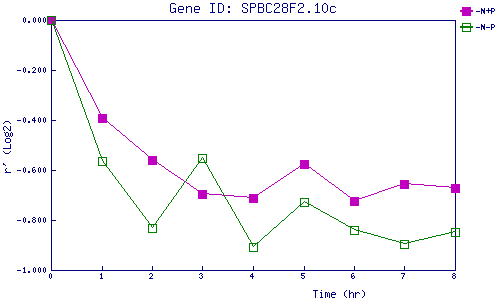
| 0 | 1 | 2 | 3 | 4 | 5 | 6 | 7 | 8 | |
| -N+P | 0.000 | -0.390 | -0.562 | -0.697 | -0.713 | -0.577 | -0.723 | -0.658 | -0.672 |
| -N-P | 0.000 | -0.565 | -0.832 | -0.550 | -0.908 | -0.729 | -0.841 | -0.894 | -0.846 |
|
-N+P: Nitrogen starved in the presence of P-factor -N-P: Nitrogen starved in the absence of P-factor |