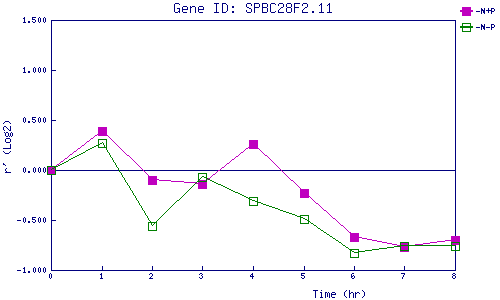
| 0 | 1 | 2 | 3 | 4 | 5 | 6 | 7 | 8 | |
| -N+P | 0.000 | 0.391 | -0.104 | -0.142 | 0.258 | -0.234 | -0.672 | -0.768 | -0.700 |
| -N-P | 0.000 | 0.271 | -0.565 | -0.074 | -0.306 | -0.493 | -0.826 | -0.763 | -0.763 |
|
-N+P: Nitrogen starved in the presence of P-factor -N-P: Nitrogen starved in the absence of P-factor |