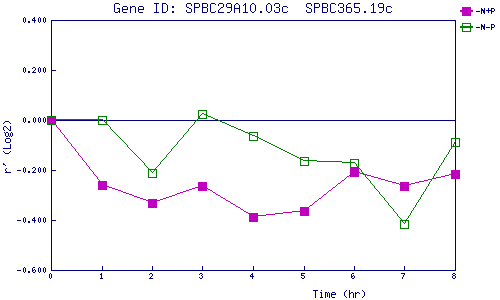
| 0 | 1 | 2 | 3 | 4 | 5 | 6 | 7 | 8 | |
| -N+P | 0.000 | -0.261 | -0.331 | -0.263 | -0.389 | -0.364 | -0.206 | -0.264 | -0.218 |
| -N-P | 0.000 | 0.001 | -0.211 | 0.025 | -0.065 | -0.163 | -0.172 | -0.415 | -0.090 |
|
-N+P: Nitrogen starved in the presence of P-factor -N-P: Nitrogen starved in the absence of P-factor |