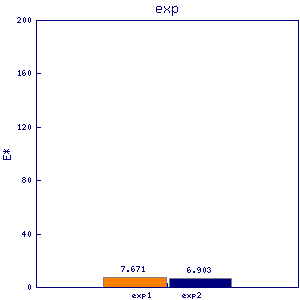
exo1
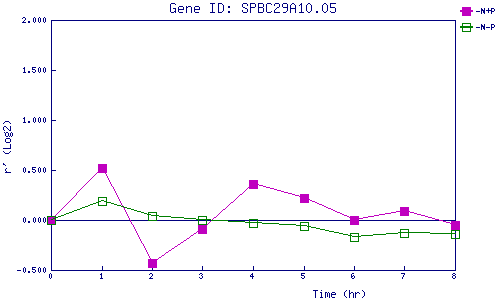
| 0 | 1 | 2 | 3 | 4 | 5 | 6 | 7 | 8 | |
| -N+P | 0.000 | 0.521 | -0.430 | -0.088 | 0.363 | 0.224 | 0.005 | 0.086 | -0.054 |
| -N-P | 0.000 | 0.190 | 0.043 | 0.001 | -0.027 | -0.062 | -0.168 | -0.129 | -0.138 |
|
-N+P: Nitrogen starved in the presence of P-factor -N-P: Nitrogen starved in the absence of P-factor |