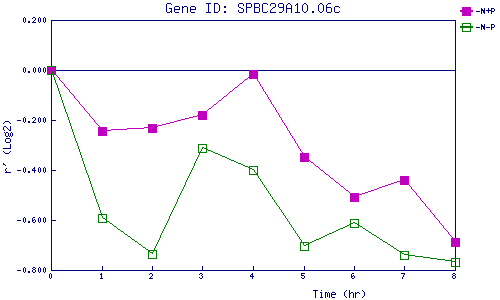
| 0 | 1 | 2 | 3 | 4 | 5 | 6 | 7 | 8 | |
| -N+P | 0.000 | -0.244 | -0.233 | -0.179 | -0.016 | -0.348 | -0.509 | -0.440 | -0.689 |
| -N-P | 0.000 | -0.593 | -0.735 | -0.311 | -0.402 | -0.705 | -0.613 | -0.741 | -0.770 |
|
-N+P: Nitrogen starved in the presence of P-factor -N-P: Nitrogen starved in the absence of P-factor |