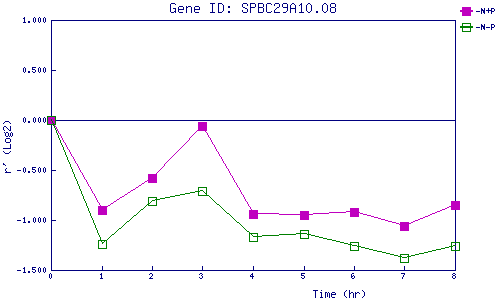
| 0 | 1 | 2 | 3 | 4 | 5 | 6 | 7 | 8 | |
| -N+P | 0.000 | -0.901 | -0.585 | -0.065 | -0.938 | -0.954 | -0.920 | -1.059 | -0.846 |
| -N-P | 0.000 | -1.238 | -0.809 | -0.714 | -1.167 | -1.139 | -1.263 | -1.377 | -1.263 |
|
-N+P: Nitrogen starved in the presence of P-factor -N-P: Nitrogen starved in the absence of P-factor |