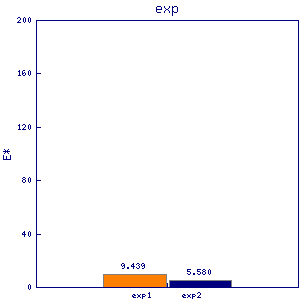
vps902 vps9b
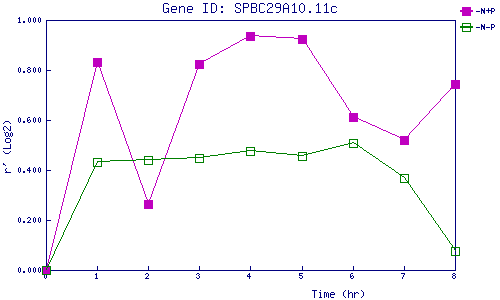
| 0 | 1 | 2 | 3 | 4 | 5 | 6 | 7 | 8 | |
| -N+P | 0.000 | 0.830 | 0.265 | 0.822 | 0.937 | 0.925 | 0.611 | 0.518 | 0.743 |
| -N-P | 0.000 | 0.430 | 0.442 | 0.446 | 0.475 | 0.455 | 0.509 | 0.370 | 0.076 |
|
-N+P: Nitrogen starved in the presence of P-factor -N-P: Nitrogen starved in the absence of P-factor |