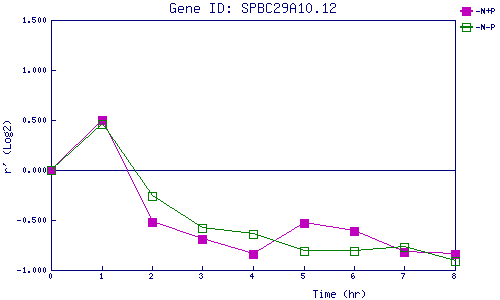
| 0 | 1 | 2 | 3 | 4 | 5 | 6 | 7 | 8 | |
| -N+P | 0.000 | 0.499 | -0.523 | -0.690 | -0.840 | -0.532 | -0.606 | -0.815 | -0.840 |
| -N-P | 0.000 | 0.461 | -0.260 | -0.580 | -0.641 | -0.813 | -0.808 | -0.769 | -0.912 |
|
-N+P: Nitrogen starved in the presence of P-factor -N-P: Nitrogen starved in the absence of P-factor |