orc1 orp1
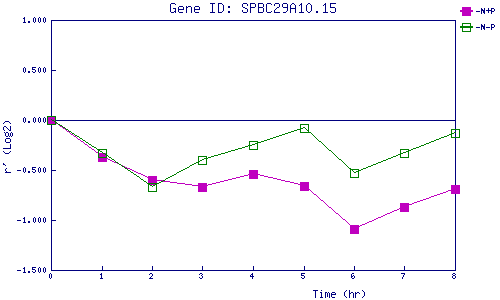
| 0 | 1 | 2 | 3 | 4 | 5 | 6 | 7 | 8 | |
| -N+P | 0.000 | -0.368 | -0.605 | -0.672 | -0.539 | -0.664 | -1.087 | -0.874 | -0.688 |
| -N-P | 0.000 | -0.326 | -0.670 | -0.403 | -0.251 | -0.082 | -0.533 | -0.334 | -0.128 |
|
-N+P: Nitrogen starved in the presence of P-factor -N-P: Nitrogen starved in the absence of P-factor |