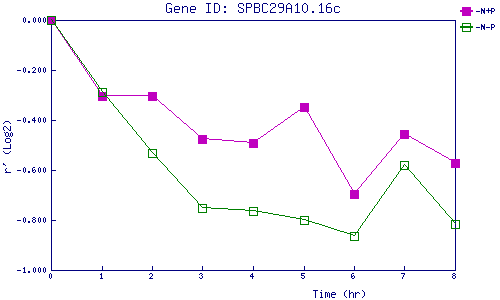
| 0 | 1 | 2 | 3 | 4 | 5 | 6 | 7 | 8 | |
| -N+P | 0.000 | -0.305 | -0.302 | -0.476 | -0.492 | -0.348 | -0.696 | -0.454 | -0.571 |
| -N-P | 0.000 | -0.290 | -0.531 | -0.752 | -0.763 | -0.801 | -0.862 | -0.580 | -0.814 |
|
-N+P: Nitrogen starved in the presence of P-factor -N-P: Nitrogen starved in the absence of P-factor |