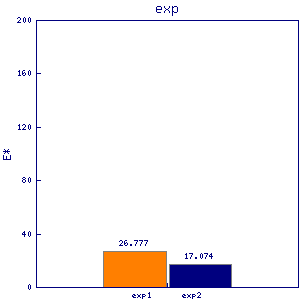
his7
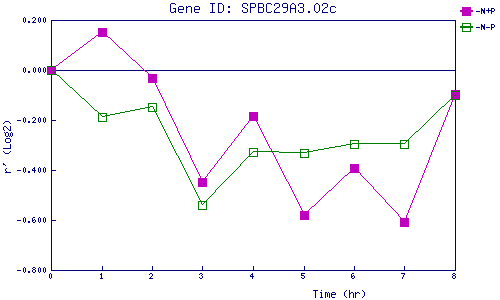
| 0 | 1 | 2 | 3 | 4 | 5 | 6 | 7 | 8 | |
| -N+P | 0.000 | 0.153 | -0.031 | -0.450 | -0.183 | -0.581 | -0.394 | -0.608 | -0.097 |
| -N-P | 0.000 | -0.189 | -0.147 | -0.541 | -0.328 | -0.331 | -0.294 | -0.294 | -0.100 |
|
-N+P: Nitrogen starved in the presence of P-factor -N-P: Nitrogen starved in the absence of P-factor |