rpl7a
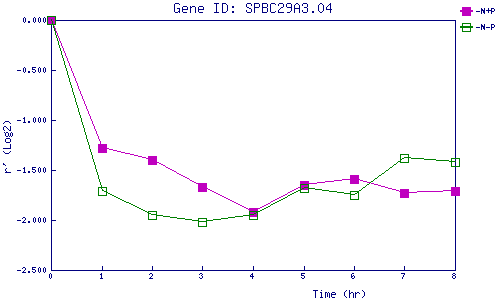
| 0 | 1 | 2 | 3 | 4 | 5 | 6 | 7 | 8 | |
| -N+P | 0.000 | -1.277 | -1.399 | -1.673 | -1.915 | -1.646 | -1.589 | -1.730 | -1.714 |
| -N-P | 0.000 | -1.713 | -1.950 | -2.018 | -1.954 | -1.684 | -1.754 | -1.383 | -1.422 |
|
-N+P: Nitrogen starved in the presence of P-factor -N-P: Nitrogen starved in the absence of P-factor |