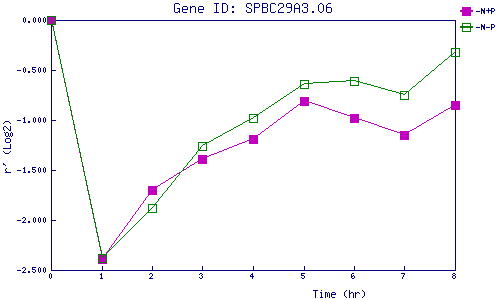
| 0 | 1 | 2 | 3 | 4 | 5 | 6 | 7 | 8 | |
| -N+P | 0.000 | -2.392 | -1.698 | -1.388 | -1.190 | -0.813 | -0.984 | -1.154 | -0.850 |
| -N-P | 0.000 | -2.377 | -1.876 | -1.257 | -0.976 | -0.640 | -0.614 | -0.748 | -0.325 |
|
-N+P: Nitrogen starved in the presence of P-factor -N-P: Nitrogen starved in the absence of P-factor |