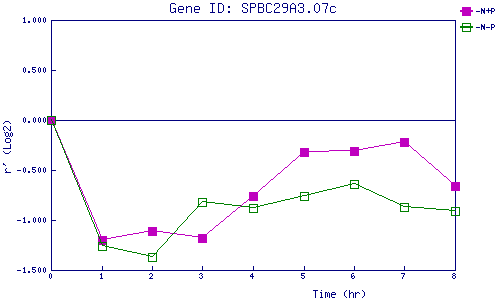
| 0 | 1 | 2 | 3 | 4 | 5 | 6 | 7 | 8 | |
| -N+P | 0.000 | -1.197 | -1.107 | -1.178 | -0.765 | -0.316 | -0.310 | -0.220 | -0.663 |
| -N-P | 0.000 | -1.259 | -1.373 | -0.820 | -0.875 | -0.762 | -0.643 | -0.871 | -0.906 |
|
-N+P: Nitrogen starved in the presence of P-factor -N-P: Nitrogen starved in the absence of P-factor |