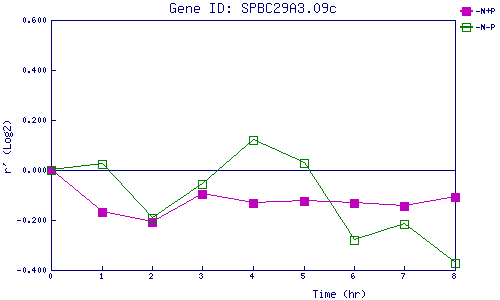
| 0 | 1 | 2 | 3 | 4 | 5 | 6 | 7 | 8 | |
| -N+P | 0.000 | -0.167 | -0.206 | -0.096 | -0.132 | -0.125 | -0.131 | -0.145 | -0.107 |
| -N-P | 0.000 | 0.022 | -0.192 | -0.056 | 0.122 | 0.029 | -0.280 | -0.216 | -0.371 |
|
-N+P: Nitrogen starved in the presence of P-factor -N-P: Nitrogen starved in the absence of P-factor |