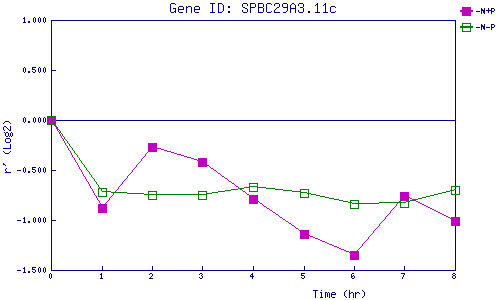
| 0 | 1 | 2 | 3 | 4 | 5 | 6 | 7 | 8 | |
| -N+P | 0.000 | -0.876 | -0.271 | -0.418 | -0.794 | -1.135 | -1.354 | -0.765 | -1.012 |
| -N-P | 0.000 | -0.721 | -0.752 | -0.751 | -0.673 | -0.727 | -0.843 | -0.828 | -0.702 |
|
-N+P: Nitrogen starved in the presence of P-factor -N-P: Nitrogen starved in the absence of P-factor |