rps9b rps9-2 rps902
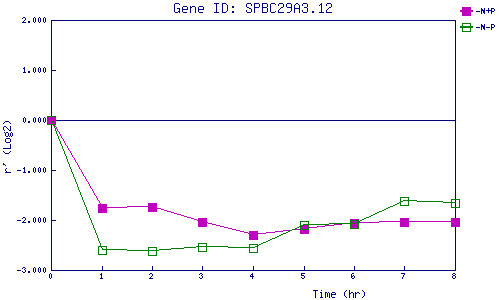
| 0 | 1 | 2 | 3 | 4 | 5 | 6 | 7 | 8 | |
| -N+P | 0.000 | -1.768 | -1.743 | -2.036 | -2.308 | -2.188 | -2.067 | -2.039 | -2.041 |
| -N-P | 0.000 | -2.599 | -2.623 | -2.544 | -2.558 | -2.107 | -2.083 | -1.617 | -1.665 |
|
-N+P: Nitrogen starved in the presence of P-factor -N-P: Nitrogen starved in the absence of P-factor |