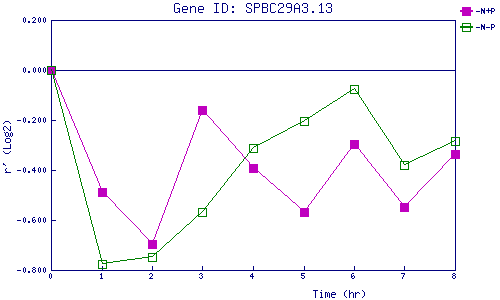
| 0 | 1 | 2 | 3 | 4 | 5 | 6 | 7 | 8 | |
| -N+P | 0.000 | -0.488 | -0.695 | -0.160 | -0.390 | -0.568 | -0.294 | -0.548 | -0.337 |
| -N-P | 0.000 | -0.776 | -0.748 | -0.566 | -0.311 | -0.205 | -0.076 | -0.380 | -0.285 |
|
-N+P: Nitrogen starved in the presence of P-factor -N-P: Nitrogen starved in the absence of P-factor |