trt1
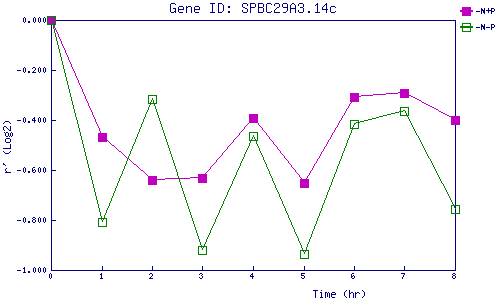
| 0 | 1 | 2 | 3 | 4 | 5 | 6 | 7 | 8 | |
| -N+P | 0.000 | -0.467 | -0.640 | -0.630 | -0.390 | -0.653 | -0.309 | -0.293 | -0.402 |
| -N-P | 0.000 | -0.806 | -0.317 | -0.920 | -0.463 | -0.936 | -0.416 | -0.363 | -0.756 |
|
-N+P: Nitrogen starved in the presence of P-factor -N-P: Nitrogen starved in the absence of P-factor |