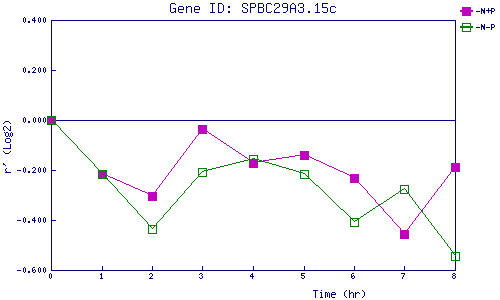
| 0 | 1 | 2 | 3 | 4 | 5 | 6 | 7 | 8 | |
| -N+P | 0.000 | -0.214 | -0.303 | -0.037 | -0.173 | -0.141 | -0.231 | -0.457 | -0.187 |
| -N-P | 0.000 | -0.217 | -0.436 | -0.208 | -0.155 | -0.217 | -0.406 | -0.275 | -0.542 |
|
-N+P: Nitrogen starved in the presence of P-factor -N-P: Nitrogen starved in the absence of P-factor |