| 0 | 1 | 2 | 3 | 4 | 5 | 6 | 7 | 8 | |
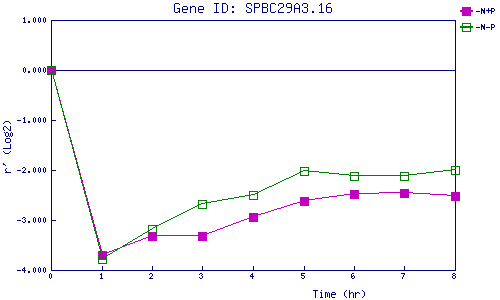
| -N+P | 0.000 | -3.703 | -3.315 | -3.321 | -2.941 | -2.617 | -2.472 | -2.466 | -2.515 |
| -N-P | 0.000 | -3.774 | -3.180 | -2.674 | -2.492 | -2.018 | -2.128 | -2.117 | -1.994 |
|
-N+P: Nitrogen starved in the presence of P-factor -N-P: Nitrogen starved in the absence of P-factor |