atf1 mts1 sss1 gad7
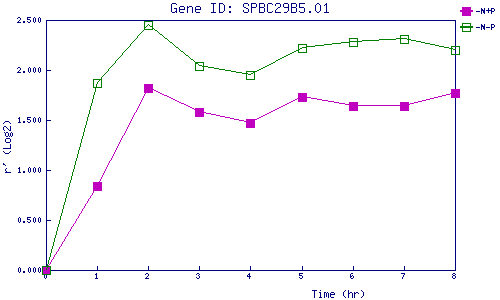
| 0 | 1 | 2 | 3 | 4 | 5 | 6 | 7 | 8 | |
| -N+P | 0.000 | 0.840 | 1.823 | 1.576 | 1.474 | 1.731 | 1.642 | 1.642 | 1.772 |
| -N-P | 0.000 | 1.873 | 2.448 | 2.046 | 1.950 | 2.217 | 2.277 | 2.311 | 2.202 |
|
-N+P: Nitrogen starved in the presence of P-factor -N-P: Nitrogen starved in the absence of P-factor |