rpl26
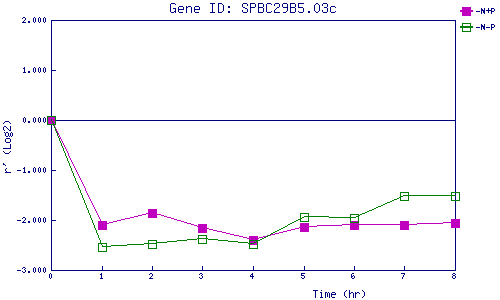
| 0 | 1 | 2 | 3 | 4 | 5 | 6 | 7 | 8 | |
| -N+P | 0.000 | -2.092 | -1.858 | -2.161 | -2.399 | -2.139 | -2.100 | -2.105 | -2.052 |
| -N-P | 0.000 | -2.540 | -2.483 | -2.386 | -2.484 | -1.945 | -1.964 | -1.512 | -1.525 |
|
-N+P: Nitrogen starved in the presence of P-factor -N-P: Nitrogen starved in the absence of P-factor |