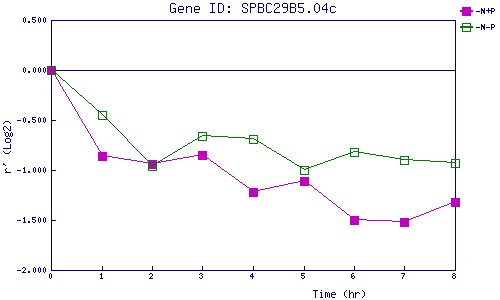
| 0 | 1 | 2 | 3 | 4 | 5 | 6 | 7 | 8 | |
| -N+P | 0.000 | -0.858 | -0.936 | -0.849 | -1.216 | -1.110 | -1.496 | -1.517 | -1.321 |
| -N-P | 0.000 | -0.446 | -0.960 | -0.665 | -0.692 | -1.005 | -0.817 | -0.904 | -0.928 |
|
-N+P: Nitrogen starved in the presence of P-factor -N-P: Nitrogen starved in the absence of P-factor |