sec22
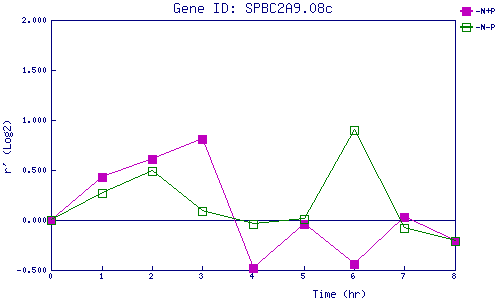
| 0 | 1 | 2 | 3 | 4 | 5 | 6 | 7 | 8 | |
| -N+P | 0.000 | 0.429 | 0.613 | 0.812 | -0.482 | -0.037 | -0.438 | 0.029 | -0.212 |
| -N-P | 0.000 | 0.271 | 0.486 | 0.093 | -0.042 | 0.011 | 0.903 | -0.076 | -0.214 |
|
-N+P: Nitrogen starved in the presence of P-factor -N-P: Nitrogen starved in the absence of P-factor |