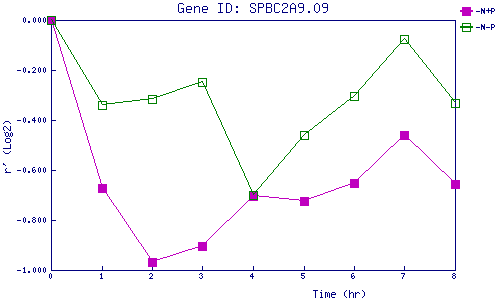
| 0 | 1 | 2 | 3 | 4 | 5 | 6 | 7 | 8 | |
| -N+P | 0.000 | -0.674 | -0.970 | -0.904 | -0.705 | -0.724 | -0.652 | -0.461 | -0.656 |
| -N-P | 0.000 | -0.341 | -0.315 | -0.250 | -0.701 | -0.459 | -0.304 | -0.076 | -0.331 |
|
-N+P: Nitrogen starved in the presence of P-factor -N-P: Nitrogen starved in the absence of P-factor |