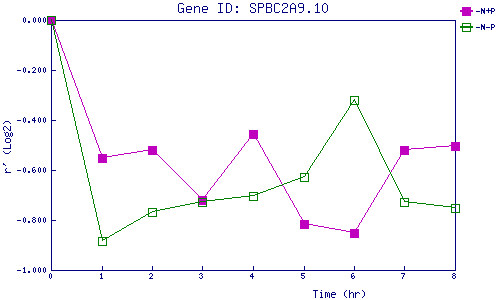
| 0 | 1 | 2 | 3 | 4 | 5 | 6 | 7 | 8 | |
| -N+P | 0.000 | -0.552 | -0.519 | -0.718 | -0.458 | -0.817 | -0.852 | -0.518 | -0.502 |
| -N-P | 0.000 | -0.883 | -0.769 | -0.727 | -0.703 | -0.629 | -0.318 | -0.730 | -0.752 |
|
-N+P: Nitrogen starved in the presence of P-factor -N-P: Nitrogen starved in the absence of P-factor |