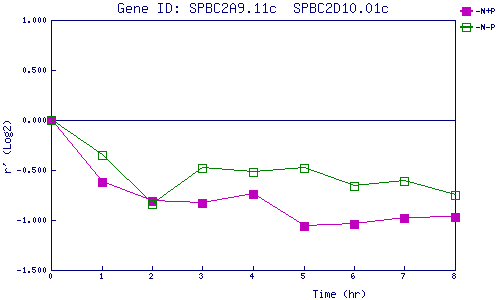
| 0 | 1 | 2 | 3 | 4 | 5 | 6 | 7 | 8 | |
| -N+P | 0.000 | -0.622 | -0.811 | -0.828 | -0.738 | -1.063 | -1.040 | -0.979 | -0.971 |
| -N-P | 0.000 | -0.353 | -0.841 | -0.477 | -0.520 | -0.485 | -0.656 | -0.611 | -0.751 |
|
-N+P: Nitrogen starved in the presence of P-factor -N-P: Nitrogen starved in the absence of P-factor |