orc6
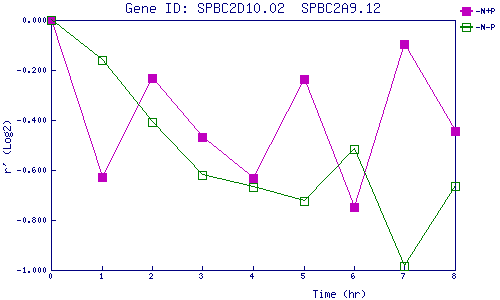
| 0 | 1 | 2 | 3 | 4 | 5 | 6 | 7 | 8 | |
| -N+P | 0.000 | -0.628 | -0.231 | -0.467 | -0.634 | -0.236 | -0.749 | -0.094 | -0.444 |
| -N-P | 0.000 | -0.162 | -0.409 | -0.619 | -0.668 | -0.724 | -0.517 | -0.982 | -0.666 |
|
-N+P: Nitrogen starved in the presence of P-factor -N-P: Nitrogen starved in the absence of P-factor |