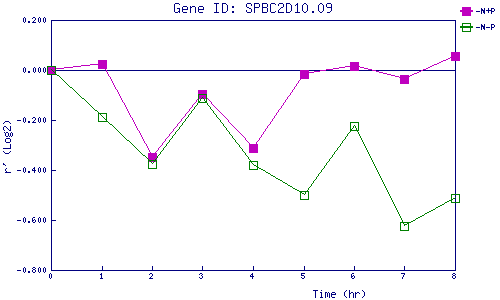
| 0 | 1 | 2 | 3 | 4 | 5 | 6 | 7 | 8 | |
| -N+P | 0.000 | 0.023 | -0.349 | -0.096 | -0.314 | -0.015 | 0.015 | -0.035 | 0.055 |
| -N-P | 0.000 | -0.189 | -0.376 | -0.114 | -0.381 | -0.499 | -0.224 | -0.624 | -0.513 |
|
-N+P: Nitrogen starved in the presence of P-factor -N-P: Nitrogen starved in the absence of P-factor |