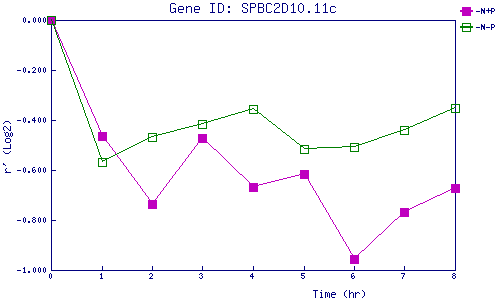
| 0 | 1 | 2 | 3 | 4 | 5 | 6 | 7 | 8 | |
| -N+P | 0.000 | -0.462 | -0.736 | -0.471 | -0.668 | -0.616 | -0.955 | -0.768 | -0.671 |
| -N-P | 0.000 | -0.566 | -0.469 | -0.418 | -0.356 | -0.516 | -0.509 | -0.442 | -0.350 |
|
-N+P: Nitrogen starved in the presence of P-factor -N-P: Nitrogen starved in the absence of P-factor |