rhp23
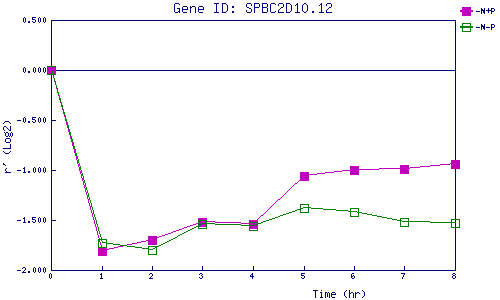
| 0 | 1 | 2 | 3 | 4 | 5 | 6 | 7 | 8 | |
| -N+P | 0.000 | -1.808 | -1.697 | -1.522 | -1.536 | -1.065 | -1.001 | -0.993 | -0.936 |
| -N-P | 0.000 | -1.735 | -1.801 | -1.542 | -1.560 | -1.375 | -1.418 | -1.517 | -1.531 |
|
-N+P: Nitrogen starved in the presence of P-factor -N-P: Nitrogen starved in the absence of P-factor |