myo51
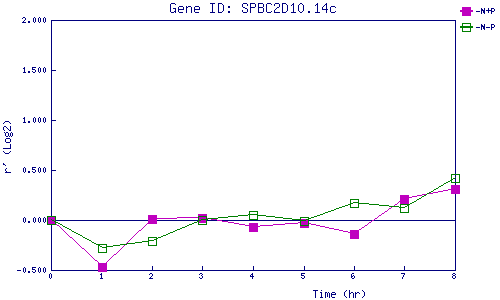
| 0 | 1 | 2 | 3 | 4 | 5 | 6 | 7 | 8 | |
| -N+P | 0.000 | -0.474 | 0.014 | 0.023 | -0.070 | -0.027 | -0.137 | 0.206 | 0.313 |
| -N-P | 0.000 | -0.283 | -0.211 | 0.005 | 0.052 | -0.012 | 0.171 | 0.116 | 0.425 |
|
-N+P: Nitrogen starved in the presence of P-factor -N-P: Nitrogen starved in the absence of P-factor |