| 0 | 1 | 2 | 3 | 4 | 5 | 6 | 7 | 8 | |
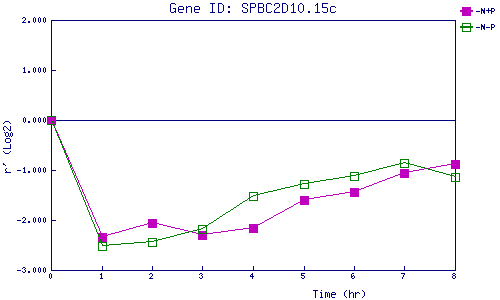
| -N+P | 0.000 | -2.338 | -2.057 | -2.303 | -2.163 | -1.610 | -1.436 | -1.059 | -0.872 |
| -N-P | 0.000 | -2.512 | -2.433 | -2.175 | -1.515 | -1.281 | -1.127 | -0.853 | -1.137 |
|
-N+P: Nitrogen starved in the presence of P-factor -N-P: Nitrogen starved in the absence of P-factor |