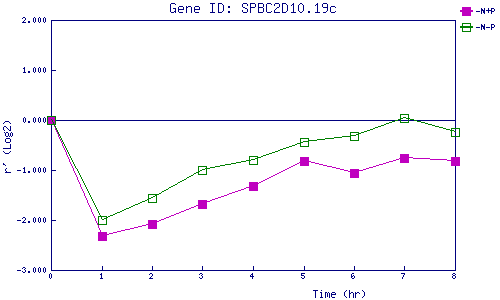
| 0 | 1 | 2 | 3 | 4 | 5 | 6 | 7 | 8 | |
| -N+P | 0.000 | -2.311 | -2.071 | -1.690 | -1.314 | -0.822 | -1.069 | -0.761 | -0.814 |
| -N-P | 0.000 | -2.009 | -1.561 | -1.008 | -0.800 | -0.439 | -0.314 | 0.031 | -0.235 |
|
-N+P: Nitrogen starved in the presence of P-factor -N-P: Nitrogen starved in the absence of P-factor |