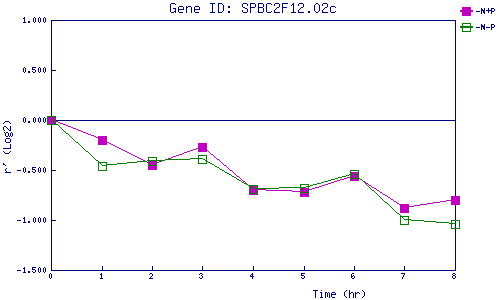
| 0 | 1 | 2 | 3 | 4 | 5 | 6 | 7 | 8 | |
| -N+P | 0.000 | -0.197 | -0.454 | -0.271 | -0.704 | -0.722 | -0.559 | -0.876 | -0.798 |
| -N-P | 0.000 | -0.458 | -0.409 | -0.392 | -0.691 | -0.685 | -0.543 | -0.995 | -1.044 |
|
-N+P: Nitrogen starved in the presence of P-factor -N-P: Nitrogen starved in the absence of P-factor |