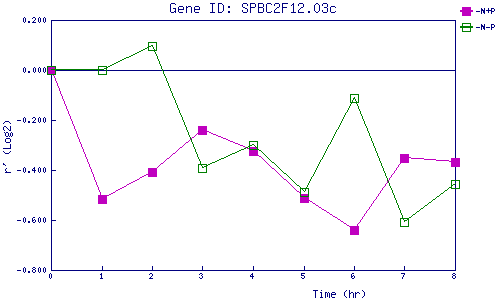
| 0 | 1 | 2 | 3 | 4 | 5 | 6 | 7 | 8 | |
| -N+P | 0.000 | -0.516 | -0.406 | -0.240 | -0.324 | -0.511 | -0.638 | -0.353 | -0.368 |
| -N-P | 0.000 | 0.000 | 0.098 | -0.394 | -0.299 | -0.487 | -0.110 | -0.606 | -0.457 |
|
-N+P: Nitrogen starved in the presence of P-factor -N-P: Nitrogen starved in the absence of P-factor |