rpl8-2 rpk37 rpk5b rpl802
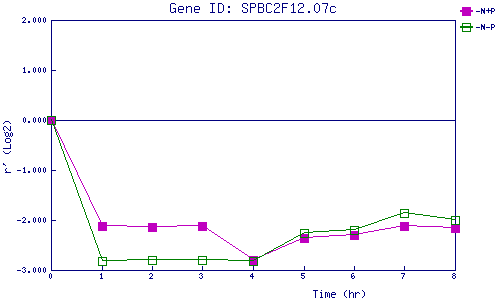
| 0 | 1 | 2 | 3 | 4 | 5 | 6 | 7 | 8 | |
| -N+P | 0.000 | -2.128 | -2.135 | -2.130 | -2.798 | -2.354 | -2.302 | -2.110 | -2.165 |
| -N-P | 0.000 | -2.816 | -2.806 | -2.792 | -2.823 | -2.261 | -2.195 | -1.869 | -1.996 |
|
-N+P: Nitrogen starved in the presence of P-factor -N-P: Nitrogen starved in the absence of P-factor |