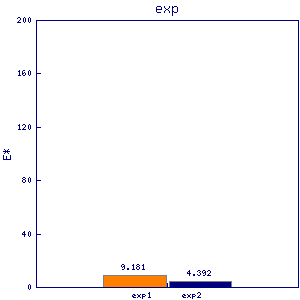
ceg1 pce1
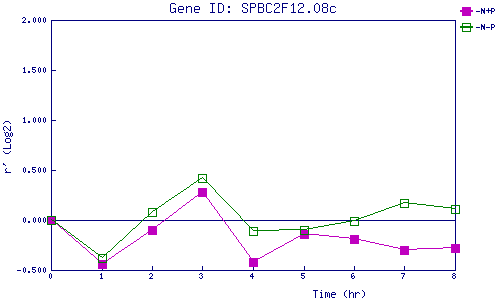
| 0 | 1 | 2 | 3 | 4 | 5 | 6 | 7 | 8 | |
| -N+P | 0.000 | -0.443 | -0.101 | 0.281 | -0.415 | -0.135 | -0.191 | -0.304 | -0.277 |
| -N-P | 0.000 | -0.376 | 0.078 | 0.425 | -0.110 | -0.096 | -0.010 | 0.167 | 0.106 |
|
-N+P: Nitrogen starved in the presence of P-factor -N-P: Nitrogen starved in the absence of P-factor |